1st Legislative District (New Jersey)
| New Jersey's 1st Legislative District | |
|---|---|
 | |
| Senator | Jeff Van Drew (D) |
| Assembly members | Bob Andrzejczak (D) R. Bruce Land (D) |
| Registration |
|
| Demographics |
|
| Population | 217,333 |
| Voting-age population | 170,857 |
| Registered voters | 148,110 |
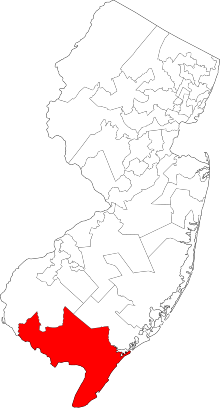
New Jersey's 1st Legislative District is one of 40 in the state, covering the Atlantic County municipalities of Corbin City, Estell Manor City and Weymouth Township; the Cape May County municipalities of Avalon Borough, Cape May City, Cape May Point Borough, Dennis Township, Lower Township, Middle Township, North Wildwood City, Ocean City, Sea Isle City, Stone Harbor Borough, Upper Township, West Cape May Borough, West Wildwood Borough, Wildwood City, Wildwood Crest Borough and Woodbine Borough; and the Cumberland County communities of Commercial Township, Downe Township, Fairfield Township, Greenwich Township, Hopewell Township, Lawrence Township, Maurice River Township, Millville City, Shiloh Borough, Stow Creek Township and Vineland City as of the 2011 apportionment.[1]
As of the 2010 United States Census, the district had a population of 217,333, of whom 170,857 (78.6%) were of voting age. The racial makeup of the district was 170,111 (78.3%) White, 24,275 (11.2%) African American, 1,008 (0.5%) Native American, 2,730 (1.3%) Asian, 92 (0.0%) Pacific Islander, 13,299 (6.1%) from some other race, and 5,818 (2.7%) from two or more races. Hispanic or Latino of any race were 37,552 (17.3%) of the population.[2] The district had 148,110 registered voters as of November 30, 2017, of whom 62,965 (42.5%) were registered as unaffiliated, 44,004 (29.7%) were registered as Republicans, 40,159 (27.1%) were registered as Democrats, and 982 (0.7%) were registered to other parties.[3]
Contents
1 Political representation
2 1965–1973
3 District composition since 1973
4 Election history
5 Election results, 1973–present
5.1 Senate
5.2 Assembly
6 Election results, 1965–1973
6.1 Senate
6.2 Assembly
7 References
Political representation
The district is represented for the 2018–2019 Legislative Session (Senate, General Assembly) in the State Senate by Jeff Van Drew (D, Dennis Township) and in the General Assembly by Bob Andrzejczak (D, Middle Township) and R. Bruce Land (D, Vineland).[4][5]
1965–1973
During the period of time after the 1964 Supreme Court decision in Reynolds v. Sims and before the establishment of a 40-district legislature in 1973, the 1st District encompassed the entirety of Atlantic, Cape May, and Gloucester counties in the 1965–1967 Senate session (two Senators elected), and Cape May and Cumberland counties in the Senate and Assembly sessions from 1967 through 1973 (one Senator and two Assembly members elected).[6][7][8]
In the 1965-1967 Senate session, Republicans John E. Hunt and Frank S. Farley were elected though one seat of the two would become vacant upon Hunt's election to the House of Representatives.[6][9] In the following two Senate sessions, Republican Robert E. Kay was elected in 1967 for a four-year term followed by Republican James Cafiero for a two-year term in 1971.[10][11]
For the two-year Assembly sessions from 1967 until 1973, Republicans held both seats for the three Assembly elections during this period with Cafiero and James R. Hurley winning in the 1967 and 1969 elections and Hurley and Joseph W. Chinnici winning in 1971.[10][12]
District composition since 1973
For the first iteration of the 1st District implemented under the 40 equal districts plan, the district once again encompassed all of Cape May and Cumberland counties.[13] For the sessions following the 1980 Census, the 1st included all of Cape May, but only included the Cumberland County cities of Bridgeton, Millville, and Vineland, and the townships of Deerfield, Maurice River, and Upper Deerfield.[14] The 1991 iteration of the 1st included all of Cape May, only Maurice River Township, Millville, and Vineland in Cumberland, and added Buena and Buena Vista Township in Atlantic County.[15] With the exception of adding Atlantic County's Somers Point, the 2001 iteration of the 1st remained the same as the 1991 district.[16]
Election history
| Session | Senate | Assembly | |
|---|---|---|---|
| 1974–1975 | James Cafiero (R) | James R. Hurley (R) | Joseph W. Chinnici (R) |
| 1976–1977 | James R. Hurley (R) | Joseph W. Chinnici (R) | |
| 1978–1979 | James Cafiero (R) | James R. Hurley (R) | Joseph W. Chinnici (R) |
| 1980–1981 | James R. Hurley (R) | Joseph W. Chinnici (R) | |
| 1982–1983 | James R. Hurley (R) | Guy F. Muziani (R) | Joseph W. Chinnici (R) |
| 1984–1985 | James R. Hurley (R) | Guy F. Muziani (R) | Joseph W. Chinnici (R) |
| 1986–1987 | Guy F. Muziani (R) | Joseph W. Chinnici (R) | |
| 1988–1989 | James R. Hurley (R)[n 1] | Frank LoBiondo (R) | Edward H. Salmon (D) |
| 1990–1991 | James Cafiero (R)[n 2] | Frank LoBiondo (R) | Edward H. Salmon (D)[n 3] |
Raymond A. Batten (D)[n 4] | |||
| 1992–1993 | James Cafiero (R) | Frank LoBiondo (R) | John C. Gibson (R) |
| 1994–1995 | James Cafiero (R) | Frank LoBiondo (R)[n 5] | John C. Gibson (R) |
Nicholas Asselta (R)[n 6] | |||
| 1996–1997 | Nicholas Asselta (R) | John C. Gibson (R) | |
| 1998–1999 | James Cafiero (R) | Nicholas Asselta (R) | John C. Gibson (R) |
| 2000–2001 | Nicholas Asselta (R) | John C. Gibson (R) | |
| 2002–2003 | James Cafiero (R) | Nicholas Asselta (R) | Jeff Van Drew (D) |
| 2004–2005 | Nicholas Asselta (R) | John C. Gibson (R) | Jeff Van Drew (D) |
| 2006–2007 | Nelson Albano (D) | Jeff Van Drew (D) | |
| 2008–2009 | Jeff Van Drew (D) | Nelson Albano (D) | Matthew W. Milam (D) |
| 2010–2011 | Nelson Albano (D) | Matthew W. Milam (D) | |
| 2012–2013 | Jeff Van Drew (D) | Nelson Albano (D) | Matthew W. Milam (D)[n 7] |
Bob Andrzejczak (D)[n 8] | |||
| 2014–2015 | Jeff Van Drew (D) | Sam Fiocchi (R) | Bob Andrzejczak (D) |
| 2016–2017 | R. Bruce Land (D) | Bob Andrzejczak (D) | |
| 2018–2019 | Jeff Van Drew (D) | R. Bruce Land (D) | Bob Andrzejczak (D) |
Notes:
^ Resigned January 2, 1990 to accept appointment to New Jersey Casino Control Commission
^ Appointed in January 1990, won special election in November 1990 to complete term
^ Resigned to become President of New Jersey Board of Public Utilities
^ Appointed April 1991
^ Resigned upon election to U.S. House of Representatives
^ Appointed January 23, 1995
^ Resigned March 1, 2013
^ Appointed March 21, 2013
Election results, 1973–present
Senate
| Party | Candidate | Votes | % | ± | |
|---|---|---|---|---|---|
Democratic | Jeff Van Drew | 35,464 | 64.8 | ||
Republican | Mary Gruccio | 18,589 | 34.0 | ||
| Cannot Be Bought | Anthony Parisi Sanchez | 652 | 1.2 | N/A | |
| Total votes | 54,705 | 100.0 | |||
| Party | Candidate | Votes | % | ± | |
|---|---|---|---|---|---|
Democratic | Jeff Van Drew | 34,624 | 59.4 | ||
Republican | Susan Adelizzi Schmidt | 22,835 | 39.2 | ||
| Independence For All | Tom Greto | 825 | 1.4 | N/A | |
| Total votes | 58,284 | 100.0 | |||
| Party | Candidate | Votes | % | |
|---|---|---|---|---|
Democratic | Jeff Van Drew | 24,557 | 54.1 | |
Republican | David S. DeWeese | 20,857 | 45.9 | |
| Total votes | 45,414 | 100.0 | ||
| Party | Candidate | Votes | % | ± | |
|---|---|---|---|---|---|
Democratic | Jeff Van Drew | 28,240 | 55.7 | N/A | |
Republican | Nicholas Asselta | 22,469 | 44.3 | ||
| Total votes | 50,709 | 100.0 | |||
| Party | Candidate | Votes | % | ± | |
|---|---|---|---|---|---|
Republican | Nicholas Asselta | 31,112 | 80.9 | ||
| HealthCare For All | Steven Fenichel | 5,986 | 15.6 | N/A | |
| English Language Only | George Cecola | 1,341 | 3.5 | N/A | |
| Total votes | 38,439 | 100.0 | |||
| Party | Candidate | Votes | % | |
|---|---|---|---|---|
Republican | James S. Cafiero | 31,150 | 50.4 | |
Democratic | William J. Hughes, Jr. | 30,709 | 49.6 | |
| Total votes | 61,859 | 100.0 | ||
| Party | Candidate | Votes | % | ± | |
|---|---|---|---|---|---|
Republican | James S. Cafiero | 35,573 | 60.8 | ||
Democratic | John Rauh | 21,340 | 36.5 | ||
Conservative | Geraldine Caiafa | 1,579 | 2.7 | N/A | |
| Total votes | 58,492 | 100.0 | |||
| Party | Candidate | Votes | % | ± | |
|---|---|---|---|---|---|
Republican | James S. Cafiero | 36,420 | 62.0 | ||
Democratic | John Spahn | 21,446 | 36.5 | ||
Libertarian | Joseph T. Ponczek | 957 | 1.6 | N/A | |
| Total votes | 58,823 | 100.0 | |||
| Party | Candidate | Votes | % | |
|---|---|---|---|---|
Republican | James S. Cafiero | 31,624 | 62.0 | |
Democratic | Ronald J. Casella | 19,404 | 38.0 | |
| Total votes | 51,028 | 100.0 | ||
| Party | Candidate | Votes | % | ± | |
|---|---|---|---|---|---|
Republican | James S. Cafiero | 33,812 | 57.6 | ||
Democratic | Edward H. Salmon | 24,925 | 42.4 | ||
| Total votes | 58,737 | 100.0 | |||
| Party | Candidate | Votes | % | ± | |
|---|---|---|---|---|---|
Republican | James R. Hurley | 29,272 | 53.4 | ||
Democratic | Donald H. Rainear | 25,512 | 46.6 | ||
| Total votes | 54,784 | 100.0 | |||
| Party | Candidate | Votes | % | ± | |
|---|---|---|---|---|---|
Republican | James R. Hurley | 30,141 | 59.8 | ||
Democratic | Christopher H. Riley | 20,232 | 40.2 | ||
| Total votes | 50,373 | 100.0 | |||
| Party | Candidate | Votes | % | |
|---|---|---|---|---|
Republican | James R. Hurley | 32,443 | 53.8 | |
Democratic | Edward H. Salmon | 27,862 | 46.2 | |
| Total votes | 60,305 | 100.0 | ||
| Party | Candidate | Votes | % | ± | |
|---|---|---|---|---|---|
Republican | James S. Cafiero | 35,416 | 62.0 | ||
Democratic | Frank Kneiser | 21,702 | 38.0 | ||
| Total votes | 57,118 | 100.0 | |||
| Party | Candidate | Votes | % | |
|---|---|---|---|---|
Republican | James S. Cafiero | 34,807 | 58.3 | |
Democratic | William E. Bowen | 24,933 | 41.7 | |
| Total votes | 59,740 | 100.0 | ||
Assembly
| Party | Candidate | Votes | % | ± | |
|---|---|---|---|---|---|
Democratic | Bob Andrzejczak | 32,554 | 31.2 | ||
Democratic | R. Bruce Land | 30,938 | 29.7 | ||
Republican | James R. Sauro | 20,445 | 19.6 | ||
Republican | Robert G. Campbell | 20,250 | 19.4 | ||
| Total votes | 104,187 | 100.0 | |||
| Party | Candidate | Votes | % | ± | |
|---|---|---|---|---|---|
Democratic | Bob Andrzejczak | 20,231 | 27.9 | ||
Democratic | R. Bruce Land | 19,140 | 26.4 | ||
Republican | Sam Fiocchi | 16,818 | 23.2 | ||
Republican | Jim Sauro | 16,395 | 22.6 | ||
| Total votes | 72,584 | 100.0 | |||
| Party | Candidate | Votes | % | ± | |
|---|---|---|---|---|---|
Democratic | Bob Andrzejczak | 29,958 | 27.2 | ||
Republican | Sam Fiocchi | 27,539 | 25.0 | ||
Democratic | Nelson Albano | 26,611 | 24.2 | ||
Republican | Kristine Gabor | 25,903 | 23.5 | ||
| Total votes | 110,011 | 100.0 | |||
| Party | Candidate | Votes | % | |
|---|---|---|---|---|
Democratic | Nelson Albano | 24,794 | 27.9 | |
Democratic | Matthew Milam | 22,207 | 25.0 | |
Republican | Samuel Fiocchi | 21,156 | 23.8 | |
Republican | Suzanne M. Walters | 20,810 | 23.4 | |
| Total votes | 88,967 | 100.0 | ||
| Party | Candidate | Votes | % | ± | |
|---|---|---|---|---|---|
Democratic | Nelson Albano | 32,375 | 27.7 | ||
Democratic | Matthew Milam | 29,810 | 25.6 | ||
Republican | Michael J. Donohue | 27,705 | 23.7 | ||
Republican | John A. McCann | 26,778 | 23.0 | ||
| Total votes | 116,668 | 100.0 | |||
| Party | Candidate | Votes | % | ± | |
|---|---|---|---|---|---|
Democratic | Nelson Albano | 27,721 | 28.8 | ||
Democratic | Matthew Milam | 24,422 | 25.3 | ||
Republican | Michael J. Donohue | 22,402 | 23.2 | ||
Republican | R. Norris Clark Jr. | 21,820 | 22.6 | ||
| Total votes | 96,365 | 100.0 | |||
| Party | Candidate | Votes | % | ± | |
|---|---|---|---|---|---|
Democratic | Jeff Van Drew | 41,381 | 35.8 | ||
Democratic | Nelson Albano | 32,500 | 28.1 | ||
Republican | John C. Gibson | 25,324 | 21.9 | ||
Republican | George Cecola | 16,338 | 14.1 | ||
| Total votes | 115,593 | 100.0 | |||
| Party | Candidate | Votes | % | ± | |
|---|---|---|---|---|---|
Democratic | Jeff Van Drew | 25,080 | 26.5 | ||
Republican | John C. Gibson | 24,187 | 25.6 | ||
Republican | Andrew J. McCrosson, Jr. | 22,927 | 24.3 | ||
Democratic | Maria LaBoy | 19,524 | 20.7 | ||
Green | Mary A. Snyder | 1,193 | 1.3 | N/A | |
Green | Carly R. Massey | 835 | 0.9 | N/A | |
Socialist | Costantino Rozzo | 768 | 0.8 | N/A | |
| Total votes | 94,514 | 100.0 | |||
| Party | Candidate | Votes | % | |
|---|---|---|---|---|
Republican | Nicholas Asselta | 36,392 | 29.6 | |
Democratic | Jeff Van Drew | 32,271 | 26.3 | |
Republican | John C. Gibson | 31,067 | 25.3 | |
Democratic | Douglas Jones-Romero | 23,147 | 18.8 | |
| Total votes | 122,877 | 100.0 | ||
| Party | Candidate | Votes | % | ± | |
|---|---|---|---|---|---|
Republican | Nicholas Asselta | 28,096 | 35.2 | ||
Republican | John C. Gibson | 26,763 | 33.5 | ||
Democratic | Mary D'Arcy Bittner | 12,146 | 15.2 | ||
Democratic | Maria A. Laboy | 11,834 | 14.8 | ||
Conservative | Geraldine Caiafa | 976 | 1.2 | ||
| Total votes | 79,815 | 100.0 | |||
| Party | Candidate | Votes | % | ± | |
|---|---|---|---|---|---|
Republican | John C. Gibson | 32,699 | 27.6 | ||
Republican | Nicholas Asselta | 32,032 | 27.0 | ||
Democratic | Jeff Van Drew | 30,221 | 25.5 | ||
Democratic | Rob O'Donnell | 21,278 | 17.9 | ||
Conservative | Rosemary Garrison | 1,325 | 1.1 | N/A | |
Conservative | Marie Pellecchia | 1,127 | 0.9 | N/A | |
| Total votes | 118,682 | 100.0 | |||
| Party | Candidate | Votes | % | ± | |
|---|---|---|---|---|---|
Republican | John C. Gibson | 24,512 | 29.2 | ||
Republican | Nicholas Asselta | 21,588 | 25.7 | ||
Democratic | Louis N. Magazzu | 19,441 | 23.2 | ||
Democratic | John R. Rauh | 18,302 | 21.8 | ||
| Total votes | 83,843 | 100.0 | |||
| Party | Candidate | Votes | % | ± | |
|---|---|---|---|---|---|
Republican | Frank A. LoBiondo | 36,941 | 31.2 | ||
Republican | John C. Gibson | 32,959 | 27.9 | ||
Democratic | Ronald J. Casella | 23,983 | 20.3 | ||
Democratic | Bruce M. Gorman | 23,493 | 19.9 | ||
Libertarian | Scott L. Derby | 959 | 0.8 | N/A | |
| Total votes | 118,335 | 100.0 | |||
| Party | Candidate | Votes | % | |
|---|---|---|---|---|
Republican | Frank A. LoBiondo | 32,063 | 31.7 | |
Republican | John C. Gibson | 28,402 | 28.1 | |
Democratic | Jennifer R. Lookabaugh | 20,872 | 20.6 | |
Democratic | Raymond A. Batten | 19,803 | 19.6 | |
| Total votes | 101,140 | 100.0 | ||
| Party | Candidate | Votes | % | ± | |
|---|---|---|---|---|---|
Democratic | Edward H. Salmon | 35,715 | 28.4 | ||
Republican | Frank A. LoBiondo | 32,600 | 25.9 | ||
Democratic | Raymond A. Batten | 31,193 | 24.8 | ||
Republican | Martin L. Pagliughi | 26,440 | 21.0 | ||
| Total votes | 125,948 | 100.0 | |||
| Party | Candidate | Votes | % | ± | |
|---|---|---|---|---|---|
Republican | Frank A. LoBiondo | 28,638 | 26.9 | ||
Democratic | Edward H. Salmon | 27,561 | 25.9 | ||
Republican | Gerald M. Thornton | 25,182 | 23.6 | ||
Democratic | Raymond A. Batten | 25,166 | 23.6 | ||
| Total votes | 106,547 | 100.0 | |||
| Party | Candidate | Votes | % | ± | |
|---|---|---|---|---|---|
Republican | Joseph W. Chinnici | 35,610 | 33.7 | ||
Republican | Guy F. Muziani | 33,978 | 32.1 | ||
Democratic | Raymond A. Batten | 18,794 | 17.8 | ||
Democratic | Peter L. Amico | 17,407 | 16.5 | ||
| Total votes | 105,789 | 100.0 | |||
| Party | Candidate | Votes | % | ± | |
|---|---|---|---|---|---|
Republican | Joseph W. Chinnici | 28,111 | 28.2 | ||
Republican | Guy F. Muziani | 25,998 | 26.1 | ||
Democratic | Edward H. Salmon | 25,790 | 25.8 | ||
Democratic | Jeanne L. Gorman | 19,890 | 19.9 | ||
| Total votes | 99,789 | 100.0 | |||
| Party | Candidate | Votes | % | |
|---|---|---|---|---|
Republican | Joseph W. Chinnici | 33,584 | 29.3 | |
Republican | Guy F. Muziani | 29,030 | 25.4 | |
Democratic | Henry Ricci | 27,018 | 23.6 | |
Democratic | William H. Woods | 24,873 | 21.7 | |
| Total votes | 114,505 | 100.0 | ||
| Party | Candidate | Votes | % | ± | |
|---|---|---|---|---|---|
Republican | James R. Hurley | 31,196 | 31.8 | ||
Republican | Joseph W. Chinnici | 28,209 | 28.8 | ||
Democratic | Randy Wilhelm | 20,034 | 20.5 | ||
Democratic | Jerry G. Livingston | 18,520 | 18.9 | ||
| Total votes | 97,959 | 100.0 | |||
| Party | Candidate | Votes | % | ± | |
|---|---|---|---|---|---|
Republican | James R. Hurley | 35,993 | 31.3 | ||
Republican | Joseph W. Chinnici | 33,104 | 28.8 | ||
Democratic | James J. Seeley | 22,606 | 19.7 | ||
Democratic | Jeffrey A. April | 22,146 | 19.3 | ||
Independent | John Phillips | 1,175 | 1.0 | N/A | |
| Total votes | 115,024 | 100.0 | |||
| Party | Candidate | Votes | % | ± | |
|---|---|---|---|---|---|
Republican | James R. Hurley | 33,213 | 30.3 | ||
Republican | Joseph W. Chinnici | 32,230 | 29.4 | ||
Democratic | Henry R. Ricci | 22,570 | 20.6 | ||
Democratic | Gary E. Greenblatt | 21,653 | 19.7 | ||
| Total votes | 109,666 | 100.0 | |||
| Party | Candidate | Votes | % | |
|---|---|---|---|---|
Republican | James R. Hurley | 36,327 | 31.1 | |
Republican | Joseph W. Chinnici | 34,104 | 29.2 | |
Democratic | Charles A. Thomas | 23,653 | 20.3 | |
Democratic | Robert J. Sheston | 22,668 | 19.4 | |
| Total votes | 116,752 | 100.0 | ||
Election results, 1965–1973
Senate
| Party | Candidate | Votes | % | |
|---|---|---|---|---|
Republican | John E. Hunt | 75,373 | 27.9 | |
Republican | Frank S. Farley | 69,767 | 25.8 | |
Democratic | Leo T. Clark | 65,059 | 24.1 | |
Democratic | Edward Savage | 59,959 | 22.2 | |
Socialist Labor | George Frenoy, Jr. | 271 | 0.1 | |
| Total votes | 270,429 | 100.0 | ||
| Party | Candidate | Votes | % | |
|---|---|---|---|---|
Republican | Robert E. Kay | 27,841 | 51.2 | |
Democratic | Robert J. Halpin | 26,149 | 48.1 | |
| Conservative | Linwood Erickson, Jr. | 364 | 0.7 | |
| Total votes | 54,354 | 100.0 | ||
| Party | Candidate | Votes | % | |
|---|---|---|---|---|
Republican | James S. Cafiero | 28,014 | 50.0 | |
Democratic | Paul R. Porreca | 27,098 | 48.4 | |
People's | John W. Gotsch | 867 | 1.5 | |
| Total votes | 55,979 | 100.0 | ||
Assembly
| Party | Candidate | Votes | % | |
|---|---|---|---|---|
Republican | James S. Cafiero | 28,436 | 26.9 | |
Republican | James R. Hurley | 28,364 | 26.8 | |
Democratic | Marvin D. Perskie | 25,212 | 23.8 | |
Democratic | Stephen Romanik | 23,091 | 21.8 | |
| Conservative | Charles E. Corson | 327 | 0.3 | |
| Conservative | John Thomas Baird | 259 | 0.2 | |
| The Good Life | Brinton P. Minshall | 118 | 0.1 | |
| Total votes | 105,807 | 100.0 | ||
| Party | Candidate | Votes | % | |
|---|---|---|---|---|
Republican | James S. Cafiero | 36,155 | 32.6 | |
Republican | James R. Hurley | 35,756 | 32.2 | |
Democratic | Robert C. Wolf | 19,679 | 17.7 | |
Democratic | Thomas J. Sorensen | 19,404 | 17.5 | |
| Total votes | 110,994 | 100.0 | ||
| Party | Candidate | Votes | % | |
|---|---|---|---|---|
Republican | James R. Hurley | 30,172 | 28.1 | |
Republican | Joseph W. Chinnici | 27,424 | 25.5 | |
Democratic | Charles Fisher | 23,898 | 22.2 | |
Democratic | John W. Sjostrom | 22,641 | 21.1 | |
Independent | Carl F. Peek | 3,290 | 3.1 | |
| Total votes | 107,425 | 100.0 | ||
References
^ Districts by Number, New Jersey Legislature. Accessed March 14, 2013.
^ DP-1: Profile of General Population and Housing Characteristics: 2010 - 2010 Demographic Profile Data, United States Census Bureau. Accessed January 29, 2014.
^ Statewide Voter Registration Summary, New Jersey Department of State, November 30, 2017. Accessed December 23, 2017.
^ Legislative Roster 2018-2019 Session, New Jersey Legislature. Accessed January 10, 2018.
^ District 1 Legislators, New Jersey Legislature. Accessed January 10, 2018.
^ abc "Results of the General Election Held on November 2, 1965" (PDF). Secretary of State of New Jersey. p. 4. Retrieved July 11, 2015..mw-parser-output cite.citation{font-style:inherit}.mw-parser-output .citation q{quotes:"""""""'""'"}.mw-parser-output .citation .cs1-lock-free a{background:url("//upload.wikimedia.org/wikipedia/commons/thumb/6/65/Lock-green.svg/9px-Lock-green.svg.png")no-repeat;background-position:right .1em center}.mw-parser-output .citation .cs1-lock-limited a,.mw-parser-output .citation .cs1-lock-registration a{background:url("//upload.wikimedia.org/wikipedia/commons/thumb/d/d6/Lock-gray-alt-2.svg/9px-Lock-gray-alt-2.svg.png")no-repeat;background-position:right .1em center}.mw-parser-output .citation .cs1-lock-subscription a{background:url("//upload.wikimedia.org/wikipedia/commons/thumb/a/aa/Lock-red-alt-2.svg/9px-Lock-red-alt-2.svg.png")no-repeat;background-position:right .1em center}.mw-parser-output .cs1-subscription,.mw-parser-output .cs1-registration{color:#555}.mw-parser-output .cs1-subscription span,.mw-parser-output .cs1-registration span{border-bottom:1px dotted;cursor:help}.mw-parser-output .cs1-ws-icon a{background:url("//upload.wikimedia.org/wikipedia/commons/thumb/4/4c/Wikisource-logo.svg/12px-Wikisource-logo.svg.png")no-repeat;background-position:right .1em center}.mw-parser-output code.cs1-code{color:inherit;background:inherit;border:inherit;padding:inherit}.mw-parser-output .cs1-hidden-error{display:none;font-size:100%}.mw-parser-output .cs1-visible-error{font-size:100%}.mw-parser-output .cs1-maint{display:none;color:#33aa33;margin-left:0.3em}.mw-parser-output .cs1-subscription,.mw-parser-output .cs1-registration,.mw-parser-output .cs1-format{font-size:95%}.mw-parser-output .cs1-kern-left,.mw-parser-output .cs1-kern-wl-left{padding-left:0.2em}.mw-parser-output .cs1-kern-right,.mw-parser-output .cs1-kern-wl-right{padding-right:0.2em}
^ New Jersey Apportionment Commission (July 20, 1967). "New Jersey Senate and Assembly Districts" (PDF). Retrieved July 11, 2015.
^ State of New Jersey (1971). "New Jersey Senate and Assembly Districts 1972–1973" (PDF). Retrieved July 11, 2015.
^ Manual of the Legislature of New Jersey - Two Hundred and Eleventh Legislature (First Session) (PDF). Skinder-Strauss Associates. 2004. p. 289-290. Retrieved July 11, 2015.
^ abcd "Results of the General Election Held on November 7, 1967" (PDF). Secretary of State of New Jersey. p. 4. Retrieved July 11, 2015.
^ abc "Results of the General Election Held on November 2, 1971" (PDF). Secretary of State of New Jersey. p. 4. Retrieved July 11, 2015.
^ ab "Results of the General Election Held on November 4, 1969" (PDF). Secretary of State of New Jersey. p. 4. Retrieved July 11, 2015.
^ "New Jersey Legislative Districts 1974–" (PDF). New Jersey Legislative Services Agency. 1973. Retrieved July 11, 2015.
^ "New Jersey Legislative Districts" (PDF). 1981. Retrieved July 11, 2015.
^ "1991 Legislative Districts" (PDF). 1991. Archived from the original (PDF) on March 4, 2016. Retrieved July 11, 2015.
^ "2001 Legislative Districts" (PDF). 2001. Archived from the original (PDF) on August 11, 2011. Retrieved July 11, 2015.
^ "Official List, Candidates for State Senate For GENERAL ELECTION 11/07/2017 Election" (PDF). Secretary of State of New Jersey. November 29, 2017. Retrieved December 23, 2017.
^ "Official List, Candidates for State Senate for GENERAL ELECTION 11/05/2013 Election" (PDF). Retrieved December 3, 2015.
^ "Official List, Candidate Returns for State Senate for November 2011 General Election" (PDF). Retrieved December 3, 2015.
^ "Official List, Candidate Returns for State Senate for November 2007 General Election" (PDF). Retrieved December 3, 2015.
^ "Official List, Candidate Returns for State Senate for November 2003 General Election" (PDF). Retrieved December 3, 2015.
^ "Official List, Candidate Returns for State Senate for November 2001 General Election" (PDF). Retrieved December 3, 2015.
^ "Official Results, General Election Returns for the Office of State Senate for Election Held November 4, 1997" (PDF). Retrieved December 3, 2015.
^ "THE 1997 ELECTIONS: RESULTS; The Races for New Jersey Senate". The New York Times. Retrieved April 20, 2016.
^ ab "Official List, General Election Returns for the Office of Senate and Assembly for Election Held November 2, 1993" (PDF). Retrieved December 3, 2015.
^ ab "Official Results, General Election, November 5, 1991" (PDF). Retrieved December 3, 2015.
^ "Official List, State Senate Unexpired Term" (PDF). Retrieved December 3, 2015.
^ ab "Candidates for the Offices of State Senate and General Assembly" (PDF). Retrieved December 3, 2015.
^ ab "Candidates for the Offices of State Senate and General Assembly" (PDF). Retrieved December 3, 2015.
^ ab "Candidates for the Offices of State Senate and General Assembly" (PDF). Retrieved December 3, 2015.
^ ab "Results of the General Election Held November 8, 1977" (PDF). Retrieved December 3, 2015.
^ ab "Results of the General Election Held November 6, 1973" (PDF). Retrieved December 3, 2015.
^ "Official List, Candidates for General Assembly For GENERAL ELECTION 11/07/2017 Election" (PDF). Secretary of State of New Jersey. November 29, 2017. Retrieved December 23, 2017.
^ "Official List, Candidates for General Assembly for GENERAL ELECTION 11/03/2015 Election" (PDF). Retrieved December 3, 2015.
^ "Official List, Candidates for General Assembly for GENERAL ELECTION 11/05/2013 Election" (PDF). Retrieved December 3, 2015.
^ "Official List, Candidate Returns for General Assembly for November 2011 General Election" (PDF). Retrieved December 3, 2015.
^ "Official List, Candidate Returns for General Assembly for November 2009 General Election" (PDF). Retrieved December 3, 2015.
^ "Official List, Candidate Returns for General Assembly for November 2007 General Election" (PDF). Retrieved December 3, 2015.
^ "Official List, Candidate Returns for General Assembly for November 2005 General Election" (PDF). Retrieved December 3, 2015.
^ "Official List, Candidate Returns for General Assembly 12-02-2003 for November 2003 General Election" (PDF). Retrieved December 3, 2015.
^ "Official List, Candidate Returns for General Assembly for November 2001 General Election" (PDF). Retrieved December 3, 2015.
^ "Official List, Candidate Returns for General Assembly 01-11-2010 for November 1999 General Election" (PDF). Retrieved December 3, 2015.
^ "Official Results, General Election Returns for the Office of State Assembly for Election Held November 4, 1997" (PDF). Retrieved December 3, 2015.
^ "THE 1997 ELECTIONS: RESULTS; The Races for the New Jersey Assebly". The New York Times. Retrieved April 20, 2016.
^ "Official List, General Election Results for the Office of General Assembly for Election Held November 7, 1995" (PDF). Retrieved December 3, 2015.
^ "Candidates for the Office of General Assembly" (PDF). Retrieved December 3, 2015.
^ "Candidates for the Office of General Assembly" (PDF). Retrieved December 3, 2015.
^ "Results of the General Election Held on November 6, 1979" (PDF). Retrieved December 3, 2015.
^ "Results of the General Election Held November 4, 1975" (PDF). Retrieved December 3, 2015.


