New Jersey's 2nd congressional district
| New Jersey's 2nd congressional district | |
|---|---|
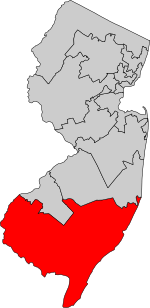 District map as of 2013 | |
| U.S. Representative | Jeff Van Drew (D–Dennis Township) |
| Distribution |
|
| Population (2010) | 733,973 |
| Median income | $65,467[1] |
| Ethnicity |
|
| Cook PVI | R+1[2] |
New Jersey's second congressional district, based in Southern New Jersey, is represented by Democrat Jeff Van Drew.

The district from 2003 to 2013
Contents
1 Counties and municipalities in the district
2 Voting
3 List of representatives
3.1 1813–1815: Two seats
3.1.1 Seat A
3.1.2 Seat B
3.2 1843–present: One seat
4 Electoral history
5 References
Counties and municipalities in the district
For the 113th and successive Congresses (based on redistricting following the 2010 Census), the congressional district contains all or portions of eight counties and 92 municipalities:[3]
Atlantic County:
- all 23 municipalities
Burlington County:
Bass River Township and Washington Township
Camden County:
- Waterford Township
Cape May County:
- all 16 municipalities
Cumberland County:
- all 14 municipalities
Gloucester County:
Clayton, East Greenwich Township (part), Elk Township, Franklin Township, Harrison Township, Mantua Township, Newfield, Pitman, South Harrison Township, Swedesboro and Woolwich Township
Ocean County:
Barnegat Light, Beach Haven, Eagleswood, Harvey Cedars, Little Egg Harbor Township, Long Beach Township, Ship Bottom, Stafford Township (part), Surf City, Tuckerton
Salem County:
- all 15 municipalities
Voting
| Election results from presidential races | ||
|---|---|---|
| Year | Office | Results |
| 2016 | President | Trump 50.6 - 46.0%[4] |
| 2012 | President | Obama 53.5 - 45.4%[4] |
| 2008 | President | Obama 53 - 45% |
| 2004 | President | Bush 50 - 49% |
| 2000 | President | Gore 54 - 43% |
| 1996 | President | Clinton 50 - 36% |
| 1992 | President | Clinton 41 - 39% |
List of representatives
| Representative | Party | Years | District home | District information | Notes |
|---|---|---|---|---|---|
| District organized from New Jersey's At-large congressional district in 1799 | |||||
 Aaron Kitchell Aaron Kitchell | Democratic-Republican | March 4, 1799 – March 3, 1801 | Hanover | Morris and Sussex Counties | |
| District organized to New Jersey's At-large congressional district in 1801 | |||||
1813–1815: Two seats
For the Thirteenth Congress, elected in 1812, two seats were apportioned, elected at-large on a general ticket. This district was organized from New Jersey's At-large congressional district.
Seat A
| Representative | Party | Years | District home | District information | Notes |
|---|---|---|---|---|---|
 James Schureman James Schureman | Federalist | March 4, 1813 – March 3, 1815 | New Brunswick | Hunterdon, Middlesex, Monmouth, and Somerset Counties |
Seat B
| Representative | Party | Years | District home | District information | Notes |
|---|---|---|---|---|---|
 Richard Stockton Richard Stockton | Federalist | March 4, 1813 – March 3, 1815 | Princeton |
The District was merged into New Jersey's At-large congressional district in 1815
1843–present: One seat
| Representative | Party | Years | District home | District information | Notes | Counties/Towns |
|---|---|---|---|---|---|---|
| District organized from New Jersey's At-large congressional district | ||||||
| George Sykes | Democratic | March 4, 1843 – March 3, 1845 | Mount Holly | Burlington, Mercer, and Monmouth | ||
| Samuel G. Wright | Whig | March 4, 1845 – July 30, 1845 | Imlaystown | Died | Burlington and Monmouth | |
| Vacant (July 30, 1845 – November 4, 1845) | ||||||
| George Sykes | Democratic | November 4, 1845 – March 3, 1847 | Mount Holly | |||
 William A. Newell William A. Newell | Whig | March 4, 1847 – March 3, 1851 | Allentown | Burlington, Mercer, and Monmouth | ||
| Charles Skelton | Democratic | March 4, 1851 – March 3, 1855 | Trenton | Burlington, Mercer, Monmouth, and Ocean | ||
 George R. Robbins George R. Robbins | Opposition | March 4, 1855 – March 3, 1857 | Hamilton Square | |||
Republican | March 4, 1857 – March 3, 1859 | |||||
 John L.N. Stratton John L.N. Stratton | Republican | March 4, 1859 – March 3, 1863 | Mount Holly | |||
 George Middleton George Middleton | Democratic | March 4, 1863 – March 3, 1865 | Allentown | |||
| William A. Newell | Republican | March 4, 1865 – March 3, 1867 | Allentown | |||
| Charles Haight | Democratic | March 4, 1867 – March 3, 1871 | ||||
 Samuel C. Forker Samuel C. Forker | Democratic | March 4, 1871 – March 3, 1873 | ||||
 Samuel A. Dobbins Samuel A. Dobbins | Republican | March 4, 1873 – March 3, 1877 | Mount Holly | Atlantic, Burlington, Mercer, and Ocean | ||
| John H. Pugh | Republican | March 4, 1877 – March 3, 1879 | ||||
 Hezekiah B. Smith Hezekiah B. Smith | Democratic | March 4, 1879 – March 3, 1881 | ||||
 J. Hart Brewer J. Hart Brewer | Republican | March 4, 1881 – March 3, 1885 | ||||
 James Buchanan James Buchanan | Republican | March 4, 1885 – March 3, 1893 | ||||
 John J. Gardner John J. Gardner | Republican | March 4, 1893 – March 3, 1903 | ||||
| March 4, 1903 – March 3, 1913 | Atlantic, Burlington, Cape May, and Cumberland | |||||
| J. Thompson Baker | Democratic | March 4, 1913 – March 3, 1915 | ||||
| Isaac Bacharach | Republican | March 4, 1915 – January 3, 1933 | ||||
| January 3, 1933 – January 3, 1937 | Atlantic, Cape May, and Cumberland | |||||
 Elmer H. Wene Elmer H. Wene | Democratic | January 3, 1937 – January 3, 1939 | ||||
| Walter S. Jeffries | Republican | January 3, 1939 – January 3, 1941 | ||||
| Elmer H. Wene | Democratic | January 3, 1941 – January 3, 1945 | ||||
 T. Millet Hand T. Millet Hand | Republican | January 3, 1945 – December 26, 1956 | Died | |||
| Vacant (December 26, 1956 – November 5, 1957) | ||||||
 Milton W. Glenn Milton W. Glenn | Republican | November 5, 1957 – January 3, 1965 | ||||
 Thomas C. McGrath, Jr. Thomas C. McGrath, Jr. | Democratic | January 3, 1965 – January 3, 1967 | ||||
 Charles W. Sandman, Jr. Charles W. Sandman, Jr. | Republican | January 3, 1967 – January 3, 1971 | Atlantic, Cape May, Cumberland, and Salem | |||
| January 3, 1971 – January 3, 1973 | [Data unknown/missing.] | |||||
| January 3, 1973 – January 3, 1975 | Atlantic, Cape May, Cumberland, Salem, and parts of Burlington and Ocean | |||||
 William J. Hughes William J. Hughes | Democratic | January 3, 1975 – January 3, 1983 | Ocean City | |||
| January 3, 1983 – January 3, 1985 | Atlantic, Cape May, Cumberland, Salem, and parts of Burlington and Ocean | |||||
| January 3, 1985 – January 3, 1993 | Atlantic, Cape May, Cumberland, Salem, and parts of Gloucester | |||||
| January 3, 1993 – January 3, 1995 | Atlantic, Cape May, Cumberland, Salem, and parts of Burlington and Gloucester | |||||
 Frank LoBiondo Frank LoBiondo | Republican | January 3, 1995 – January 3, 2003 | Ventnor | |||
| January 3, 2003 – January 3, 2013 |  Atlantic, Cape May, Cumberland, Salem, and parts of Burlington, Camden, and Gloucester | |||||
| January 3, 2013 – January 3, 2019 | Atlantic, Cape May, Cumberland, Salem, and parts of Burlington, Camden, Gloucester, and Ocean | |||||
| Jeff Van Drew | Democratic | January 3, 2019 – present | Dennis Township | |||
Electoral history
| Democrat | Votes | Pct | Republican | Votes | Pct | 3rd Party | Party | Votes | Pct | 3rd Party | Party | Votes | Pct | 3rd Party | Party | Votes | Pct | 3rd Party | Party | Votes | Pct | 3rd Party | Party | Votes | Pct | ||||||||||
|---|---|---|---|---|---|---|---|---|---|---|---|---|---|---|---|---|---|---|---|---|---|---|---|---|---|---|---|---|---|---|---|---|---|---|---|
1844 | George Sykes | 7,573 | 51.9% | William Irick | 6,995 | 48.0% | |||||||||||||||||||||||||||||
1844 | George Sykes | 6,503 | 48.5% | Samuel G. Wright | 6,919 | 51.5% | |||||||||||||||||||||||||||||
1846 | Thomas E. Combes | 5,959 | 43.3% | William A. Newell | 7,531 | 54.7% | (FNU) Ridson | Native American Party | 280 | 2.0% | |||||||||||||||||||||||||
1848 | Stacy G. Potts | 8,382 | 45.9% | William A. Newell | 9,877 | 54.1% | |||||||||||||||||||||||||||||
1852 | Charles Skelton | 10,229 | 52.2% | William Brown | 9,238 | 47.1% | Daniel Busby | Native American Party | 134 | 0.7% | |||||||||||||||||||||||||
1854 | Nathaniel S. Rue | 7,769 | 42.4% | George R. Robbins | 10,539 | 57.6% | |||||||||||||||||||||||||||||
1856 | James W. Wall | 10,692 | 47.7% | George R. Robbins | 11,723 | 52.3% | |||||||||||||||||||||||||||||
1858 | James W. Wall | 8,767 | 43.3% | John L. N. Stratton | 11,471 | 56.7% | |||||||||||||||||||||||||||||
1860 | Augustus Green | 12,154 | 47.2% | John L. N. Stratton | 13,582 | 52.8% | |||||||||||||||||||||||||||||
1862 | George Middleton | 12,182 | 52.9% | William Brown | 10,864 | 47.1% | |||||||||||||||||||||||||||||
1864 | George Middleton | 13,091 | 48.4% | William A. Newell | 13,953 | 51.6% | |||||||||||||||||||||||||||||
1866 | Charles Haight | 13,825 | 50.6% | William A. Newell | 13,476 | 49.4% | |||||||||||||||||||||||||||||
1868 | Charles Haight | 16,309 | 51.3% | James F. Rusling | 15,494 | 48.7% | |||||||||||||||||||||||||||||
1870 | Samuel C. Forker | 15,899 | 50.7% | William A. Newell | 15,452 | 49.3% | |||||||||||||||||||||||||||||
1872 | Samuel C. Forker | 11,787 | 45.4% | Samuel A. Dobbins | 14,192 | 54.6% | |||||||||||||||||||||||||||||
1874 | Andrew J. Smith | 13,011 | 48.2% | Samuel A. Dobbins | 13,977 | 51.8% | |||||||||||||||||||||||||||||
1876 | Hezekiah B. Smith | 15,485 | 49.2% | John Howard Pugh | 16,015 | 50.8% | |||||||||||||||||||||||||||||
1878 | Hezekiah B. Smith | 14,610 | 50.6% | John Howard Pugh | 18,580 | 47.4% | Charles E. Baker | National Prohibition | 568 | 2.0% | |||||||||||||||||||||||||
1880 | Hezekiah B. Smith | 16,536 | 46.6% | J. Hart Brewer | 18,580 | 52.4% | Samuel A. Dobbins | Greenback Party | 342 | 1.0% | |||||||||||||||||||||||||
1882 | Lewis Parker | 14,535 | 47.8% | J. Hart Brewer | 15,604 | 51.3% | Edward T. Howland | Greenback Party | 270 | 0.9% | |||||||||||||||||||||||||
1884 | Franklin Gauntt | 16,853 | 45.4% | James Buchanan | 19,144 | 51.5% | Henry B. Howell | National Prohibition | 898 | 2.4% | Samuel A. Dobbins | Greenback Party | 271 | 0.7% | |||||||||||||||||||||
1886 | Elias S. Reed | 15,065 | 42.6% | James Buchanan | 17,767 | 50.2% | Leonard Brown | National Prohibition | 2,547 | 7.2% | |||||||||||||||||||||||||
1888 | Chauncey H. Beasley | 19,104 | 44.6% | James Buchanan | 22,407 | 52.4% | Minot C. Morgan | National Prohibition | 1,292 | 3.0% | |||||||||||||||||||||||||
1890 | Wilson D. Haven | 16,352 | 46.6% | James Buchanan | 17,515 | 50.0% | Leonard Brown | National Prohibition | 1,200 | 3.4% | |||||||||||||||||||||||||
1892 | George D. Wetherill | 20,592 | 45.9% | John J. Gardner | 22,716 | 50.6% | F. French | National Prohibition | 1,348 | 3.0% | D. Duroe | People's Party | 169 | 0.4 | |||||||||||||||||||||
1894 | Martin L. Haines | 12,900 | 34.45% | John J. Gardner | 22,641 | 60.5% | Jacob D. Joslin | National Prohibition | 1,278 | 3.4% | William B. Ellis | People's Party | 630 | 1.7 | |||||||||||||||||||||
1896 | Abraham E. Conrow | 13,969 | 29.3% | John J. Gardner | 31,418 | 66.0% | R. Lowber Temple | National Democratic | 1,076 | 2.3% | J. Bailie Adams | National Prohibition | 1,036 | 2.2% | George Yardley | Socialist Labor | 115 | 0.2 | |||||||||||||||||
1898 | John F. Hall | 17,367 | 40.5% | John J. Gardner | 24,035 | 56.1% | Joseph J. Currie | National Prohibition | 1,294 | 3.0% | John P. Weigel | Socialist Labor | 153 | 0.4 | |||||||||||||||||||||
1900 | Thomas J. Prickett | 17,351 | 34.3% | John J. Gardner | 31,359 | 61.9% | Harry S. Powell | National Prohibition | 1,419 | 2.8% | J. Louis Pancoast | Social Democratic | 418 | 0.8% | Emil F. Wegener | Socialist Labor | 75 | 0.1% | |||||||||||||||||
1902 | Thomas A. Gash | 9,465 | 29.6% | John J. Gardner | 19,966 | 62.5% | Marion R. Owen | National Prohibition | 2,323 | 7.3% | Daniel W. Davis | Socialist Labor | 199 | 0.6% | |||||||||||||||||||||
1904 | Samuel E. Perry | 13,035 | 34.2% | John J. Gardner | 26,296 | 59.7% | Thomas H. Landon | National Prohibition | 1,406 | 4.0% | Robert W. Buckley | Socialist | 254 | 2.1% | Marion R. Owen | People's Dem. | 209 | 2.1%| | |||||||||||||||||
1906 | Samuel E. Perry | 8,921 | 28.6% | John J. Gardner | 19,637 | 63.0% | William Riddle | Labor & Lincoln | 1,249 | 4.0% | W. F. Tower | National Prohibition | 900 | 2.9% | Morris Korshet | Socialist | 380 | 1.2% | Marion R. Owen | Home Rule | 105 | 0.3% | |||||||||||||
1908 | Edward Burd Grubb | 20,506 | 44.8% | John J. Gardner | 23,906 | 52.2% | James E. Steelman | National Prohibition | 1,012 | 2.2% | John B. Leeds | Socialist | 347 | 0.8% | |||||||||||||||||||||
1910 | George Hampton | 16,915 | 38.2% | John J. Gardner | 22,861 | 51.6% | William Riddle | Independent Labor | 3,508 | 7.9% | John W. Hughes | National Prohibition | 738 | 1.7% | George S. Rawcliffe | Socialist | 295 | 0.7% | |||||||||||||||||
1912 | J. Thompson Baker | 16,130 | 45.0% | John J. Gardner | 12,330 | 34.4% | Francis D. Potter | Progressive | 7,384 | 20.6% | |||||||||||||||||||||||||
1914 | J. Thompson Baker | 14,352 | 35.2% | Isaac Bacharach | 21,448 | 52.6% | William H. Bright | Progressive Roosevelt | 3,508 | 8.6% | James Chapman | National Prohibition | 775 | 1.9% | G. A. McKeon | Socialist | 673 | 1.7% | |||||||||||||||||
1916 | William Myers | 14,220 | 34.2% | Isaac Bacharach | 24,865 | 59.7% | J. Ward Gamble | National Prohibition | 1,654 | 4.0% | Abraham Warren | Socialist | 880 | 2.1% | |||||||||||||||||||||
1918 | John T. French | 8,610 | 28.2% | Isaac Bacharach | 20,744 | 67.9% | Levi B. Sharp | National Prohibition | 1,206 | 3.9% | |||||||||||||||||||||||||
1920 | William E. Jonah | 21,511 | 29.5% | Isaac Bacharach | 51,006 | 70.0% | George E. Strother | Socialist | 331 | 0.5% | |||||||||||||||||||||||||
1922 | Charles S. Stevens | 22,001 | 30.2% | Isaac Bacharach | 50,925 | 69.8% | |||||||||||||||||||||||||||||
1924 | Charles S. Stevens | 21,185 | 23.8% | Isaac Bacharach | 67,668 | 76.2% | |||||||||||||||||||||||||||||
1926 | Frank Melville | 12,775 | 19.4% | Isaac Bacharach | 53,174 | 80.6% | |||||||||||||||||||||||||||||
1928 | George R. Greis | 30,856 | 23.7% | Isaac Bacharach | 99,109 | 76.3% | |||||||||||||||||||||||||||||
1930 | Hans Froelicher, Jr. | 17,125 | 20.1% | Isaac Bacharach | 67,729 | 79.7% | Florian Ambroseh | Communist | 155 | 0.2% | |||||||||||||||||||||||||
1932 | Harry R. Coulomb | 35,257 | 36.4% | Isaac Bacharach | 60,963 | 62.9% | Albert H. Schreiber | Socialist-Labor | 413 | 0.4% | Walter L. Yerkes | Prohibition | 292 | 0.3% | |||||||||||||||||||||
1934 | Charles W. Ackley | 48,743 | 49.3% | Isaac Bacharach | 49,824 | 50.4% | Franklin L. Watkins | Socialist-Labor | 226 | 0.2% | |||||||||||||||||||||||||
1936 | Elmer H. Wene | 55,580 | 50.0% | Isaac Bacharach | 50,958 | 45.8% | Ted Lenore | Townsend Nonpartisan | 3,241 | 2.9% | U. G. Robinson | Prop. Home Protection | 1,206 | 1.1% | Franklin L. Watkins | Socialist | 97 | 0.1% | Frank A. Yacovelli | Townsend Social Justice | 86 | 0.1% | Thomas F. Ogilvie | End Poverty Const | 18 | <0.1% | |||||||||
1938 | Elmer H. Wene | 55,344 | 49.1% | Walter S. Jeffries | 57,090 | 50.1% | Isaac Stalberg | Roosevelt Liberal Independent | 222 | 0.2% | Margaret V. Moody | National Prohibition | 91 | 0.1% | Anthon B. Ferretti | Independent Peoples | 47 | <0.1% | Frank B. Hubin | Roosevelt Independent | 23 | <0.1% | |||||||||||||
1940 | Elmer H. Wene | 60,392 | 52.4% | Walter S. Jeffries | 54,897 | 47.6% | Joseph B. Sharp | Prohibition | 35 | <0.1% | |||||||||||||||||||||||||
1942 | Elmer H. Wene | 40,478 | 53.0% | Benjamin D. Foulois | 35,930 | 47.0% | |||||||||||||||||||||||||||||
1944 | Edison Hedges | 42,862 | 45.6% | T. Millet Hand | 51,194 | 54.4% | |||||||||||||||||||||||||||||
1946 | Edward T. Keeley | 26,740 | 32.9% | T. Millet Hand | 54,511 | 67.1% | |||||||||||||||||||||||||||||
1948 | William E. Stringer | 38,194 | 37.5% | T. Millet Hand | 62,804 | 61.7% | Thomas F. Ogilvie | Progressive | 764 | 0.8% | |||||||||||||||||||||||||
1952 | Charles Edward Rupp | 46,174 | 36.6% | T. Millet Hand | 79,955 | 63.4% | |||||||||||||||||||||||||||||
1954 | Clayton E. Burdick | 37,541 | 36.4% | T. Millet Hand | 65,551 | 63.6% | Morris Karp | Socialist-Labor | 56 | 0.1% | |||||||||||||||||||||||||
1956 | Thomas C. Stewart | 39,383 | 32.0% | T. Millet Hand | 83,433 | 67.8% | Morris Karp | Socialist-Labor | 151 | 0.1% | |||||||||||||||||||||||||
1958 | Joseph G. Hancock | 50,558 | 46.1% | Milton W. Glenn | 58,621 | 53.4% | Morris Karp | Socialist-Labor | 547 | 0.5% | |||||||||||||||||||||||||
1960 | John A. Miller | 59,520 | 43.2% | Milton W. Glenn | 77,894 | 56.5% | Morris Karp | Socialist-Labor | 338 | 0.2% | |||||||||||||||||||||||||
1962 | Paul R. Porreca | 54,317 | 46.7% | Milton W. Glenn | 61,285 | 52.7% | Elwin Baker | Socialist Labor | 625 | 0.5% | |||||||||||||||||||||||||
1964 | Thomas C. McGrath, Jr. | 73,264 | 50.8% | Milton W. Glenn | 70,997 | 49.2% | |||||||||||||||||||||||||||||
1966 | Thomas C. McGrath, Jr. | 65,494 | 46.9% | Charles W. Sandman, Jr. | 72,014 | 51.5% | Albert Ronis | Socialist Labor | 1,259 | 0.9% | Lindwood W. Erickson, Jr. | Conservative | 991 | 0.7% | |||||||||||||||||||||
1968 | David Dichter | 73,361 | 44.4% | Charles W. Sandman, Jr. | 91,218 | 55.3% | Albert Ronis | Socialist Labor | 505 | 0.3% | |||||||||||||||||||||||||
1970 | William J. Hughes | 64,882 | 48.3% | Charles W. Sandman, Jr. | 69,392 | 51.7% | |||||||||||||||||||||||||||||
1972 | John D. Rose | 69,374 | 34.3% | Charles W. Sandman, Jr. | 133,096 | 65.7% | |||||||||||||||||||||||||||||
1974 | William J. Hughes | 109,763 | 57.3% | Charles W. Sandman, Jr. | 79,064 | 41.3% | Andrew Wenger | Independent | 2,693 | 1.4% | |||||||||||||||||||||||||
1976 | William J. Hughes | 141,753 | 61.7% | James R. Hurley | 87,915 | 38.3% | |||||||||||||||||||||||||||||
1978 | William J. Hughes | 112,768 | 66.4% | James H. Biggs | 56,997 | 33.6% | |||||||||||||||||||||||||||||
1980 | William J. Hughes | 135,437 | 57.5% | Beech N. Fox | 97,072 | 41.2% | Robert C. Rothhouse | Libertarian | 2,262 | 1.0% | Adele Frisch | Socialist Labor | 939 | 0.4% | |||||||||||||||||||||
1982 | William J. Hughes | 102,826 | 68.0% | John J. Mahoney | 47,069 | 31.1% | Bruce Powers | Libertarian | 1,233 | 0.8% | |||||||||||||||||||||||||
1984 | William J. Hughes | 132,841 | 63.2% | Raymond G. Massie | 77,231 | 36.8% | |||||||||||||||||||||||||||||
1986 | William J. Hughes | 83,821 | 68.3% | Alfred J. Bennington, Jr. | 35,167 | 28.6% | Len Smith | Pro Life, Anti-Abortion | 3,812 | 3.1% | |||||||||||||||||||||||||
1988 | William J. Hughes | 134,505 | 65.7% | Kirk W. Conover | 67,759 | 33.1% | Richard A. Schindewolf, Jr. | Pro-Life Conservative | 2,372 | 1.2% | |||||||||||||||||||||||||
1990 | William J. Hughes | 97,698 | 88.2% | (no candidate) | William A. Kanengiser | Populist | 13,120 | 11.8% | |||||||||||||||||||||||||||
1992 | William J. Hughes | 132,465 | 55.9% | Frank A. LoBiondo | 98,315 | 41.5% | Roger W. Bacon | Libertarian | 2,575 | 1.1% | Joseph Ponczek | Anti-Tax | 2,067 | 0.9% | Andrea Lippi | Freedom, Equality, Prosperity | 1,605 | 0.7% | |||||||||||||||||
1994 | Louis N. Magazzu | 56,151 | 35.4% | Frank A. LoBiondo | 102,566 | 64.6% | |||||||||||||||||||||||||||||
1996 | Ruth Katz | 83,890 | 38.0% | Frank A. LoBiondo | 133,131 | 60.3% | David Rodger Headrick | Independent | 1,439 | 0.7% | Judith Lee Azaren | Independent | 1,174 | 0.5% | Andrea Lippi | Independent | 1,084 | 0.5% | |||||||||||||||||
1998 | Derek Hunsberger | 43,563 | 30.8% | Frank A. LoBiondo | 93,248 | 65.9% | Glenn Campbell | Independent | 2,955 | 2.1% | Mary A. Whittam | Independent | 1,748 | 1.2% | |||||||||||||||||||||
2000 | Edward G. Janosik | 74,632 | 31.9% | Frank A. LoBiondo | 155,187 | 66.4% | Robert Gabrielsky | Independent | 3,252 | 1.4% | Constantino Rozzo | Independent | 788 | 0.3% | |||||||||||||||||||||
2002 | Steven A. Farkas | 47,735 | 28.3% | Frank A. LoBiondo | 116,834 | 69.2% | Roger Merle | Green | 1,739 | 1.0% | Michael J. Matthews, Jr. | Libertarian | 1,720 | 1.0% | Costantino Rozzo | Socialist Party USA | 771 | 0.5% | |||||||||||||||||
2004 | Timothy J. Robb | 86,792 | 32.7% | Frank A. LoBiondo | 172,779 | 65.1% | Willie Norwood | Jobs Equality Business | 1,993 | 0.8% | Michael J. Matthews, Jr. | Libertarian | 1,767 | 0.7% | Jose David Alcantara | Green | 1,516 | 0.6% | Costantino Rozzo | Socialist Party USA | 595 | 0.2% | |||||||||||||
2006 | Viola Thomas-Hughes | 64,277 | 35.6% | Frank A. LoBiondo | 111,245 | 61.6% | Robert E. Mullock | Preserve Green Space | 3,071 | 1.7% | Lynn Merle | A New Direction | 992 | 0.5% | Thomas Fanslau | We The People | 603 | 0.3% | Willie Norwood | Socialist | 385 | 0.2% | |||||||||||||
2008 | David C. Kurkowski | 110,990 | 39.1% | Frank A. LoBiondo | 167,701 | 59.1% | Jason M. Grover | Green | 1,763 | 0.6% | Peter Frank Boyce | Constitution | 1,551 | 0.5% | Gary Stein | Rock the Boat | 1,312 | 0.5% | Costantino Rozzo | Socialist Party USA | 648 | 0.2% | |||||||||||||
2010 | Gary Stein | 51,690 | 30.9% | Frank A. LoBiondo | 109,460 | 65.5% | Peter Frank Boyce | Constitution | 4,120 | 2.5% | Mark Lovett | marklovett.us | 1,123 | 0.7% | Vitov Valdes-Munoz | American Labor | 727 | 0.4% | |||||||||||||||||
2012 | Cassandra Shober | 116,463 | 40.3% | Frank A. LoBiondo | 166,679 | 57.7% | John Ordille | Libertarian | 2,699 | 0.9% | Charles Lukens | Constitutional Conservative | 1,329 | 0.5% | David W. Bowen, Sr. | The People's Agenda | 1,010 | 0.3% | Frank Faralli, Jr. | Conservative, Compassionate, Creative | 892 | 0.3% | |||||||||||||
2014 | Bill Hughes, Jr. | 62,986 | 37.0% | Frank A. LoBiondo | 104,958 | 61.7% | Alexander H. Spano | Democratic-Republican Party (New) | 637 | 0.4% | Gary Stein | (Various slogans) | 575 | 0.3% | Costantino Rozzo | American Labor Party (New) | 473 | 0.3% | Bayode Olabisi | Making Us Better | 447 | 0.3% | |||||||||||||
2016 | David Cole | 110,838 | 37.2% | Frank A. LoBiondo | 176,338 | 59.2% | John Ordille | Libertarian Party | 3,773 | 1.3% | James Keenan | Make Government Work | 2,653 | 0.9% | Steven Fenichel | Representing the 99% | 1,574 | 0.5% | Eric Beechwood | People's Independent Progressive | 1,387 | 0.5% | Gabriel Brian Franco | For Political Revolution | 1,232 | 0.4% |
References
^ https://www.census.gov/mycd/?st=34&cd=02
^ "Partisan Voting Index – Districts of the 115th Congress" (PDF). The Cook Political Report. April 7, 2017. Retrieved April 7, 2017..mw-parser-output cite.citation{font-style:inherit}.mw-parser-output .citation q{quotes:"""""""'""'"}.mw-parser-output .citation .cs1-lock-free a{background:url("//upload.wikimedia.org/wikipedia/commons/thumb/6/65/Lock-green.svg/9px-Lock-green.svg.png")no-repeat;background-position:right .1em center}.mw-parser-output .citation .cs1-lock-limited a,.mw-parser-output .citation .cs1-lock-registration a{background:url("//upload.wikimedia.org/wikipedia/commons/thumb/d/d6/Lock-gray-alt-2.svg/9px-Lock-gray-alt-2.svg.png")no-repeat;background-position:right .1em center}.mw-parser-output .citation .cs1-lock-subscription a{background:url("//upload.wikimedia.org/wikipedia/commons/thumb/a/aa/Lock-red-alt-2.svg/9px-Lock-red-alt-2.svg.png")no-repeat;background-position:right .1em center}.mw-parser-output .cs1-subscription,.mw-parser-output .cs1-registration{color:#555}.mw-parser-output .cs1-subscription span,.mw-parser-output .cs1-registration span{border-bottom:1px dotted;cursor:help}.mw-parser-output .cs1-ws-icon a{background:url("//upload.wikimedia.org/wikipedia/commons/thumb/4/4c/Wikisource-logo.svg/12px-Wikisource-logo.svg.png")no-repeat;background-position:right .1em center}.mw-parser-output code.cs1-code{color:inherit;background:inherit;border:inherit;padding:inherit}.mw-parser-output .cs1-hidden-error{display:none;font-size:100%}.mw-parser-output .cs1-visible-error{font-size:100%}.mw-parser-output .cs1-maint{display:none;color:#33aa33;margin-left:0.3em}.mw-parser-output .cs1-subscription,.mw-parser-output .cs1-registration,.mw-parser-output .cs1-format{font-size:95%}.mw-parser-output .cs1-kern-left,.mw-parser-output .cs1-kern-wl-left{padding-left:0.2em}.mw-parser-output .cs1-kern-right,.mw-parser-output .cs1-kern-wl-right{padding-right:0.2em}
^ Plan Components Report, New Jersey Redistricting Commission, December 23, 2011. Accessed November 6, 2016.
^ ab Nir, David. "Daily Kos Elections' presidential results by congressional district for the 2016 and 2012 elections", Daily Kos, November 19, 2012. Accessed November 12, 2017.
^ "Election Statistics". Office of the Clerk of the House of Representatives. Retrieved 2013-09-20.
^ 2012 Official General Election Results, House of Representatives, New Jersey Department of State, for 2012 results
^ Lundy, F. L.; Fitzgerald, Thomas F.; Gosson, Louis C.; Fitzgerald, Josephine A.; Dullard, John P.; Gribbins, J. Joseph (1907-01-01). Fitzgerald's Legislative Manual, State of New Jersey. J.A. Fitzgerald.
^ Lundy, F. L.; Fitzgerald, Thomas F.; Gosson, Louis C.; Fitzgerald, Josephine A.; Dullard, John P.; Gribbins, J. Joseph (1905-01-01). Manual of the Legislature of New Jersey. J.A. Fitzgerald.
^ Fitzgerald, Thomas F. (1911-01-01). Fitzgerald's Legislative Manual, State of New Jersey. J.A. Fitzgerald.
^ Langland, James (1914-01-01). The Troy Record Almanac and Year-book. The Troy record Co.
^ Lundy, F. L.; Fitzgerald, Thomas F.; Gosson, Louis C.; Fitzgerald, Josephine A.; Dullard, John P.; Gribbins, J. Joseph (1915-01-01). Manual of the Legislature of New Jersey. J.A. Fitzgerald.
^ Lundy, F. L.; Fitzgerald, Thomas F.; Gosson, Louis C.; Fitzgerald, Josephine A.; Dullard, John P.; Gribbins, J. Joseph (1917-01-01). Manual of the Legislature of New Jersey. J.A. Fitzgerald.
^ Lundy, F. L.; Fitzgerald, Thomas F.; Gosson, Louis C.; Fitzgerald, Josephine A.; Dullard, John P.; Gribbins, J. Joseph (1919-01-01). Manual of the Legislature of New Jersey. J.A. Fitzgerald.
^ Greeley, Horace (1910-01-01). The Tribune Almanac and Political Register. The Tribune Association.
^ The Tribune Almanac and Political Register for ... Greeley & McElrath. 1903-01-01.
Martis, Kenneth C. (1989). The Historical Atlas of Political Parties in the United States Congress. New York: Macmillan Publishing Company.
Martis, Kenneth C. (1982). The Historical Atlas of United States Congressional Districts. New York: Macmillan Publishing Company.
- Congressional Biographical Directory of the United States 1774–present


